There can be national improvements in maternal health services while there is inequality in service provision. The aim of this study was to investigate the reported ethnic disparities in the period 2019–2025 in Bangladesh and to evaluate the performance of district-level Random Forest model in predicting institutional delivery coverage over simpler statistical models. The Multiple Indicator Cluster Survey tables were published with nine indicators for reproductive and maternal health for the Bengali and Other household-ethnicity groups for two rounds of the survey. Percentage-point differences and coverage ratios were not calculated by re-constructing individual records or by computing the standard errors of the surveys. The 2019 ecological dataset consisted of 64 districts along with 4 contextual predictors. The training-mean, ordinary least-squares, ridge, and Random Forest models were evaluated and compared using leave-one-division-out validation, and conditional performance stability was evaluated using division-block resampling. The gap between institutional and non-institutional delivery has reduced from 36.5 to 27.9 per cent in favour of Bengali households. The percentage of Bengali households covered was 71.2% and Other was 43.3% in 2025. Skilled-antenatal-care gap decreased from 49.2 to 25.0 points. The situation was reversed for modern contraceptive use, with 63.1% of households in the Other category using modern contraceptive methods while 54.6% of Bengali households did. The mean absolute errors for the training-mean, ordinary least-squares, ridge and Random Forest models were 15.44%, 11.19%, 11.13% and 11.97% respectively. There were some decreases in ethnic disparities, but disparities existed for services. Random Forest didn't perform better than simpler models. Monitoring of ethnicity sensitivity and geographically structured validation are complementary, and aggregate predictions cannot identify individual ethnic effects or causal mechanisms.
Research ArticleHealth EquityUnder review
Ethnic and Geographical Inequalities in Maternal Healthcare Coverage in Bangladesh in a Repeated Cross-Sectional and Ecological Study
Correspondence: aasif.wales@gmail.com
Abstract
Keywords health equitymaternal healthcareethnicityBangladeshecological analysisrandom forest
1. Introduction
While The country has made great strides in maternal and reproductive health, but progress at the national level might mask inequities in access by population groups and geographical regions. These differences are especially important with regard to maternal health care, as women are expected to use services during the antenatal, delivery, and postnatal periods, and financial status, distance, transportation, availability of services, quality, and acceptability can all impact service utilization (Ahmed et al., 2013; Bohren et al., 2014; Levesque et al., 2013; Thaddeus & Maine, 1994). These are particular concerns with ethnic minority groups. Ethnic health disparities regarding water and sanitation, hygiene and access to health-related resources are well documented in Bangladesh's past, but evidence for recent shifts in ethnic disparities in maternal health is limited to broad ethnic categories. Both the Multiple Indicator Cluster Surveys of 2019 and 2025 have maternal and reproductive health indicators disaggregated by ethnicity. The published Other category of household-ethnicity is a heterogeneous category, which is not a specific community but can be used cautiously for monitoring inequalities at population-level (Alam, 2022; Alam & Sheoti, 2024; BBS & UNICEF Bangladesh, 2019, 2026).
Secondly, there is the rising trend of using machine-learning models in public-health forecasting. While Random Forest can model nonlinear relationships, it does not necessarily lead to better prediction as complexity increases, especially for geographically structured data when conventional random splits are used. Geographical validation that denies entire administrative divisions offers a more stringent test of transportability of the model (Breiman, 2001; Meyer et al., 2018; Roberts et al., 2017; Shmueli, 2025). While previous studies in Bangladesh have explored factors associated with institutional delivery and mothers' utilisation of health services, few studies have incorporated repeated ethnic-disparity monitoring and statistically and machine-learning-based comparisons of the models (Huda et al., 2019; Khan et al., 2022; Pervin et al., 2021).
The aim of this research was to assess ethnic and geographical disparities in maternal health coverage in Bangladesh and to investigate the potential of Random Forest to improve the predictive performance over simpler statistical models. Specifically, the study analysed the difference in maternal/ reproductive health coverage rates between Bengali and Other household-ethnicity groups between 2019 and 2025, compared district-level variation in institutional delivery rates, compared the performance of the ordinary least-squares, ridge regression, and Random Forest models, and tested the robustness of the models using resampling, sensitivity analysis, and permutation importance.
The study was guided by four research questions: How did the reported ethnic differences in maternal and reproductive healthcare coverage change between 2019 and 2025; What was the relationship between the district-level variation in institutional delivery and selected contextual indicators; Could the results of the Random Forest model be anticipated to be better than simpler models for the geographical holds-out; and How consistent were the comparisons among the models across geographical blocks and across the sensitivity analyses? A novelty of the study is the use of repeated ethnicity-disaggregated monitoring of maternal health with geographically structured model evaluation while maintaining the inequality, association, and prediction of the model conceptually distinct. It's not so much a new algorithm, but a clear accounting of persistent inequalities in maternal health and whether there is value in making public-health surveillance more nuanced.
2. Literature Review
2.1. Maternal care coverage and access
The first time a woman attends for antenatal care, repeated contacts, institutional delivery and the assessment of the postpartum status are separate service encounters. The three delays framework separates out seeking, reaching, and receiving care, and the access framework adds in service characteristics and people's capacity to perceive unmet health needs, pay, and engage. There is no single indicator that can support continuity and quality on this pathway (Levesque et al., 2013; Thaddeus & Maine, 1994).Financial, geographical, household and service influences impacting delivery care are identified in reviews. Just being available is not enough; it also depends on perceived quality, treatment, transportation and acceptability. Institutional delivery measures being born at a facility but does not imply the safety or the experience of the facility (Bohren et al., 2014, 2015; Gabrysch & Campbell, 2009).
2.2. Evidence from Bangladesh and ethnic disaggregation
Studies in Bangladesh link timely attendance at antenatal care with education and community factors, but they differentiate between providers, contact frequency and timely attendance. Socio-economic and regional variations in postnatal care have also been recently found. The results of these findings would suggest the need for a further analysis of inequalities that happens at each service stage (Huda et al., 2019; Khan et al., 2022; Pervin et al., 2021; Supti et al., 2026).Both inequitable access to water, sanitation and hygiene as well as insufficient policy recognition has been pointed at in the context of Bangladesh in the research on ethnic inequalities. Similar maternal-health tables include the monitoring question in another service domain; however, it is not possible to identify specific communities or mechanisms with the broad Other household-ethnicity category (Alam, 2022; Alam & Sheoti, 2024)
2.3. Geographical prediction and the research gap
Random Forest can capture nonlinear relationships, but better predictive power needs to be demonstrated relative to simpler models. There are different requirements for evidence in description, prediction and explanation. An individual ethnic disadvantage cannot be explained by district predictions nor be determined as a modifiable cause, particularly in a small ecological dataset (Breiman, 2001; Carriero et al., 2025; Shmueli,2010, 2025).No previous single person studies and no ethnic WASH studies offer a direct contrast of repeated national maternal-care or district "held out" benchmarks. This study is similar in the sense that it has all of the monitoring questions yet maintains the estimands separate (Alam & Sheoti, 2024; Huda et al., 2019; Khan et al., 2022; Pervin et al., 2021).The absolute and relative ethnic comparisons describe the service-specific shortcomings, whereas the geographical validation considers the value of the complexity of the model. The expanded workflow retained also includes the elements of divisional trend inference, joint-coverage bounds, and census-linked analyses, which will provide outputs that are not currently available.
3. Methodology
3.1. Study design and analytical workflow
This was a second quantitative study based on published aggregate survey estimates. The first group was a repeated cross sectional comparison of ethnic group percentages at the national level. The second was an ecological modelling study on the district level delivery coverage of institutional delivery in 2019. Analysis of the components was carried out independently, and interpretation of the components combined only at the level of public-health monitoring. No linkage between persons, households, clusters and ethnic-group records with district predictions. Ethnic differences are not identified as a function of wealth, education, residence or service supply in the design (BBS & UNICEF 2019, 2021, 2026). The methodology is based on seven steps as shown in Figure 1: data sources, data extraction and harmonisation, equity trends, co-coverage bounds, district models, geographical validation and robustness and interpretation. National, divisional and district estimates continue to be analytical units. Microdata are not reconstructed within the household and associations are not interpreted as causal (Wakefield, 2008).
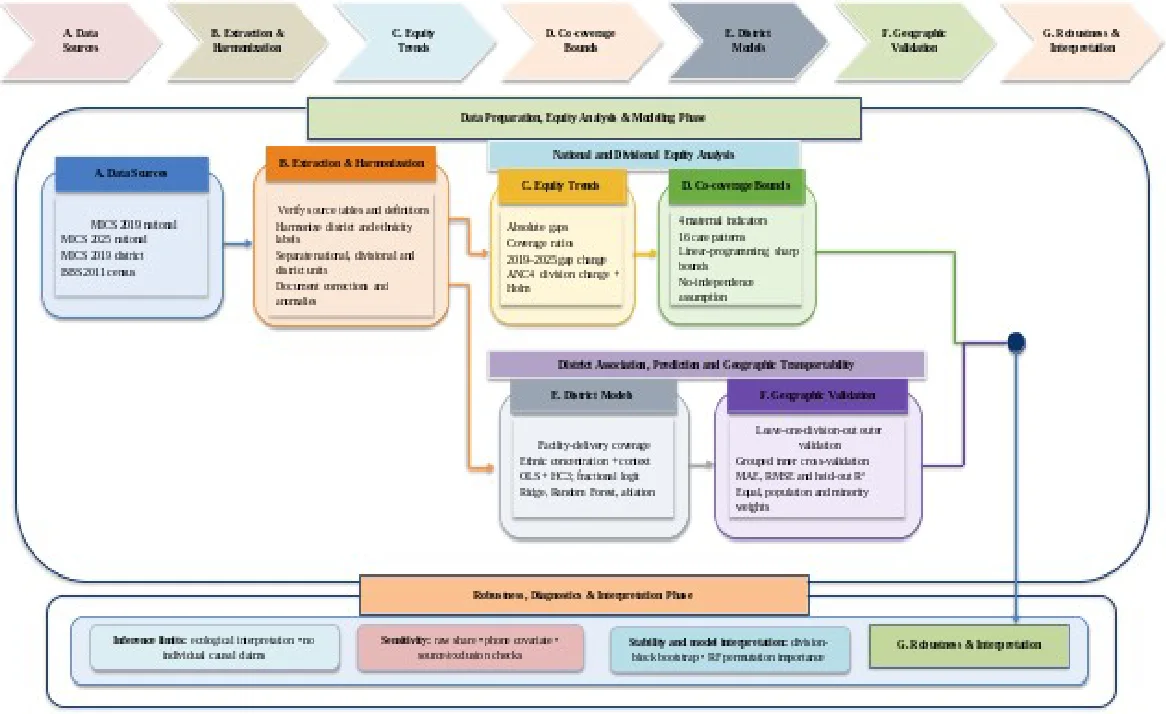
Note. Stages A and B prepare the data. Stages C and D address national and divisional equity. Stages E and F address district association, prediction, and geographical transportability. Stage G assesses stability and interpretation.
Implementation status. Available results include national ethnic contrasts and a fixed model setting district benchmark. Analyses for divisional ANC4 test, co-coverage bounds, census linkage, HC3 inference, fractional logit, ablation, grouped inner tuning, and population- or minority-weighted evaluation are not available. Below are their statistical specifications which are retained as components which are either still to be implemented or recorded as outputs, but no results from these components are claimed.
3.2. Stage A Data sources and analytical units
Three The reported analyses are based on three published survey publications and an additional workflow is provided that includes the BBS 2011 census for a district ethnic-concentration measure and evaluation weights. Table 1 breaks out survey year, publication date, analytical unit, and current use. The final report of the MICS 2025 was released in June 2026. This District summary is based on the 2019 survey, not a third survey round (BBS & UNICEF, 2019, 2021, 2026).
Table 1. Data sources and analytical use
| Publication | Reference period | Analytical unit | Analytical use |
|---|---|---|---|
| MICS 2019 national report | 2019 | Published ethnic-group percentages | Historical ethnic coverage; divisional comparison specified |
| MICS 2019 district summary, published 2021 | 2019 | 64 districts in eight divisions | Four contextual predictors and institutional delivery coverage |
| MICS 2025 Survey Findings Report, published June 2026 | 24 February–30 June 2025 | Published ethnic-group percentages | Recent ethnic coverage; divisional comparison specified |
| BBS Population and Housing Census 2011 | 2011 | District population and ethnic counts | Specified for ethnic concentration and evaluation weights; linkage not reported |
The 2025 MICS employed a 2-stage stratified sampling design and engaged 61,207 households and 64,405 women in their 15-49 age group. For the ethnicity analysis, there were 36 published estimates on nine indicators, two ethnicity, and two survey years and for the ecological analysis, there were 64 districts in eight divisions. These published estimates are not considered respondent-level observations (BBS & UNICEF, 2021, 2026).
Ethnicity was reported at household level and harmonised as Bengali and Other. The Other category is not a specific ethnic community, which does not offer any individual estimates for the Chakma, Marma, Garo and Santal communities. It was therefore only viewed as a general category of household ethnicity (BBS & UNICEF, 2026).
3.3. Stage B Extraction harmonisation and variable definitions
Structured extraction ledger was created with published percentages, denominators, table details, page locations and URLs. National ethnicity tables were matched using indicator, survey year and category, and district data was harmonised by district name. No individuals' records were reconstructed, and no demographic or health values were imputed. To enable census linkage the following information was found to be required: Verified district records, consistent district-to-division assignment, documentation of records where information could not be matched, duplicate keys, source anomalies, and historical ethnicity definitions.
The main equity goal was institutional delivery for women aged 15-49 years who had a live birth in the last two years. Other maternal indicators were skilled antenatal care, having had four or more antenatal contacts, attendance at skilled delivery, maternal postnatal checks and newborn postnatal checks. Reproductive indicators included: Use of modern contraceptive, use of modern family planning methods to meet the family planning need, unmet family planning need. Definitions and eligible populations were the same as in the original MICS reports (BBS & UNICEF, 2019, 2026).
Institutional delivery coverage was the continuous outcome evaluated in the context of district modelling. The contextual predictors included literacy of women between 15 and 24 years, access to the internet in the household, ownership of a mobile phone among women aged 15 to 49 years and early childbearing. These were district level contexts, not necessarily the features of the same women contributing to outcome. Not included: Wealth, distance, facility readiness, parity and language; not selected through stepwise significance testing: Predicators (BBS & UNICEF, 2021; Filmer & Pritchett, 2001; Heinze et al., 2018).
3.4. Stage C Equity trends and statistical uncertainty
The difference were signed absolute differences that is, the difference between the Other-category percentage and the Bengali percentage for each indicator and year. The negative difference meant a lower coverage for positively oriented services in the Other category. Unmet need was interpreted separately as a lower % is favourable. The relative measure was Other-to-Bengali ratio (percentage) published. The difference in the signed gap was calculated as the difference between the gap in 2025 and the gap in 2019. Positive change was descriptive narrowing for maternal indicators for which there were negative gaps in both years. This is not a difference in differences causal estimator (Barros & Victora, 2013).
Let p be a published percentage, j be an indicator, t be a year in which a survey was conducted, O be the category Other, and B be the category Bengali. Signed gap D, coverage ratio R and change in gap ΔD are defined as follows:
D_{jt} = p_{O,jt} - p_{B,jt}; R_{jt} = p_{O,jt} / p_{B,jt} (1)
ΔD_j = D_{j,2025} - D_{j,2019} (2)
Gaps and gap changes were reported in percentage points and coverage ratios were dimensionless. Narrowing was interpreted as a movement toward zero, but unmet family-planning need was measured separately with lower scores being favourable. Since the indicators varied in eligibility, direction, and meaning no pooled equity index was built. Estimates were rounded to one decimal place and rounding uncertainty was separated from sampling uncertainty.
Published weighted denominators were not converted into numbers of successes and failures. If the survey weights, strata and clusters, and design-based standard errors were not provided, then no new binomial confidence intervals, chi-square tests or significance claims were created. Ethnic differences were thus published as descriptive contrasts in published point estimates (BBS & UNICEF, 2026).
Design-based standard errors should be used for change over survey rounds in divisional comparisons of ANC4. If a survey covariance is available, this can be included and the standard error for the change will be the sum of the two variances under independence.
δ_d = p_{d,2025} - p_{d,2019}; z_d = δ_d / (√(SE_{d,2025}^2+SE_{d,2019}^2)) (3)
The Holm adjustment is used to control the Family-wise error rate for the 8 divisional tests. Arrange the unadjusted p-values in ascending order, and compare the k-th p-value to 0.05/9 −k up to the first non-rejection. Report the division-specific changes, the uncertainty of these changes and unadjusted and adjusted p values (Holm, 1979). The following tests are found in the manuscript without any outputs reported. Weighted denominators are not able to provide the missing design-based SEs.
3.5. Stage D Bounds on maternal co-coverage
The co-coverage analysis indicated specifies four indicators of maternal care, which have a common eligible population and reference birth. Together, they have 16 distributions of care. The four indicators provided do not explicitly name the indicators, so they need to be specifically named and denominators need to be reconciled before numerical bounds can be reported. In particular, if an ANC4 indicator is defined for any of these providers, this does not mean that the providers automatically provide skilled antenatal attendance.
Suppose that we have a four-element binary pattern, s, and a population probability, qₛ, and a marginal coverage proportion for service j, pⱼ. The feasible set Q is the set of non-negative probabilities of the pattern which sum to one and generate all four marginals:
∑_{s∈{0,1}⁴} q_s = 1; ∑_{s∈{0,1}⁴} s_j q_s = p_j; q_s ≥ 0 (4)
If there is an event A, then define cₛ = 1 for patterns that satisfy A, and cₛ = 0 otherwise.If a pattern satisfies an event A, define cₛ = 1; otherwise define cₛ = 0, where A is a defined event. To find the sharp lower bound or upper bound, minimise or maximise the sum of cₛqₛ over Q. The goal chooses the pattern (1, 1, 1, 1) in case of receiving all four services. “Sharp” is used to describe a case where every endpoint is reached with at least one joint distribution that meets the given constraints. It is not to imply that the joint distribution is either known or estimated exactly. No independence assumption is made.
Published rounding allows the rounding interval to vary from one marginal to the other instead of forcing the rounding to be equal to the published round. Structural restrictions are only allowed if they are warranted by the source definitions. For each group and year, report the target event, constraints that are feasible, the solver status, and endpoint solutions. These are identification bounds given the marginals, not survey confidence intervals. There is no numerical co-coverage result for this revision.
3.6. Stage E District association and prediction models
The same predictors and data partitions were used in the comparison of four models. For the training mean, the additive relationships were estimated by ordinary least squares, for ridge regression, the standardisation of the training set was used, and the L2 penalty was 1.0, for random forest, 500 trees were used, maximum depth was three, minimum leaf size was five, bootstrap sampling was applied, and all four predictors were included at each split. The random seed was fixed at 20261013 (Breiman, 2001; Riley et al., 2019). Since the results were to be a continuous level of institutional delivery coverage, regression metrics were applied instead of classification metrics. The comparison was conducted to determine if Random Forest offered additional predictive value when compared to simpler models, without the assumption that a more complex model would provide more value (Christodoulou et al., 2019; Steyerberg et al., 2010).
Yᵢ represents district institutional-delivery coverage on a 0–100 scale, and Xᵢ₋ₖ represents one of four contextual percentages, reported for the same district. The intercept is included in the additive specification:
Y_i = β_0 + ∑_{k=1}^{4} β_k X_{ik} + ε_i (5)
A coefficient on a predictor that is measured in percentages is the difference in the outcome for every one percentage difference in the predictor. To get the scale reported in the association results multiply it by ten. Ridge uses an L2 penalty for standardised predictor coefficients, but the intercept does not have a penalty. Only each set of training data is used to estimate the standardisation parameters. The existing forest settings and ridge penalty were not chosen via grouped inner cross-validation.
In addition, the extended version of the association model includes the contextual covariates, census ethnic concentration. To demonstrate ethnic concentration, the numerator, denominator, reference year, and unit must be explicitly specified, along with any transformations. The specified sensitivity measure is the raw district ethnic-population share. The primary change is not recorded in the provided files, so there is not a specific variable that is fitted as such. The ethnicity coefficient would be a conditional association between districts, not an individual comparison of Bengali and Other women.
The expanded OLS model is specified with HC3 heteroskedasticity-consistent uncertainty. It incorporates squared residuals into the sandwich covariance estimator, which means that the variance of the residuals is less biased to the downside at high-leverage observations. Provide and interpret coefficients on a specified scale, standard errors of the HC3, interval construction, and leverage diagnostics. HC3 does not directly model spatial dependence, survey measurement error, or even uncertainty in the linkage to the census. The coefficient intervals already given in Section 4.5 are division-block stability intervals, and cannot be labeled as HC3 intervals.
Fractional logit is the functional-form sensitivity analysis that is specified. It works by clustering district coverage into 100 buckets with a logistic conditional mean, and has Bernoulli quasi-likelihood and robust uncertainty. The answer is still a district proportion and no man-made individual event counts are reconstructed (Papke & Wooldridge, 1996).
E(y_i | Z_i) = 1 / (1 + exp(-Z_i'γ)) (6)
The vector Z contains the intercept and the documented census and contextual predictors. Report average marginal effects on the percentage-point scale to compare the fractional-logit and linear specifications. Ablation compares otherwise equivalent models with and without the ethnic-concentration term, using identical outer folds and the same evaluation weights. A separate phone-covariate sensitivity compares inclusion and exclusion of phone ownership. The associated HC3, fractional-logit, and ablation outputs are not available in the current results.
3.7. Stage F Geographical validation and performance measures
Primary validation was with eight-fold leave-one-division-out cross-validation. A model not previously trained on a district from a district's division predicted each district. The number of districts in the training sets was between 51 and 60, and 4 and 13 districts were in the test sets. Standardisation was only applied to the data of training. The division identifiers were used to identify partitions, rather than to predict it. This geographically structured design would allow for testing transfer between the observed divisions more directly than a random split design that would introduce some local spatial dependence, but does not rule out all spatial dependence nor test transfer to a later year (Kapoor & Narayanan, 2023; Meyer et al., 2018; Roberts et al., 2017).The entire process comprises of outer cross validation with grouped inner cross validation in each outer training set. All preprocessing, feature selection and tuning should be performed in the inner test division, which should not be accessible to the outer test division. The inner folds are controlled to stop them from moving so they can be trained; settings are determined by a loss and a search grid; The pipeline is refitted on the entire outer training set before it predicts the outer division. There are eight divisions in total with seven of them being training divisions for inner validation. The search grid, grouping, tie rule, selection metric and selected settings need to be documented. There are no fixed-setting predictions that are available to be used as benchmarks and are not reported in this nested procedure.
Pooled mean absolute error (MAE), root mean squared error (RMSE) and held-out R-squared were used to summarise performance. The values of MAE and RMSE are given in percentage points. Calculations for R squared were done on all 64 held out predictions as opposed to an average of the R squareds in each of the divisions. The mean signed prediction error was tested for geographically concentrated over prediction and the division specific errors were tested for the under prediction.
Let the residual be the difference between the predicted coverage and the reported coverage of the district i, eᵢ ≥ 0; use the evaluation weight, wᵢ ≥ 0, for the district i. The average absolute discrepancy (ADE) is summarised by MAE and the root mean square error (RMSE) accentuates large discrepancies.
MAE_w = (∑_{i=1}^{n} w_i|e_i|) / (∑_{i=1}^{n} w_i); RMSE_w = √((∑_{i=1}^{n} w_i e_i^2) / (∑_{i=1}^{n} w_i)) (7)
Held-out R² compares the pooled squared prediction error with variation around the corresponding weighted observed mean:
R_w^2 = 1 - (∑_{i=1}^{n} w_i e_i^2) / (∑_{i=1}^{n} w_i(Yᵢ - Ȳw)^2) (8)
Pooled held-out \(R^2\) was calculated using the weighted observed mean and the mean signed error showed the systematic overprediction or underprediction. The measures of performance were derived from the predictions made at the district level, not the districts' average scores. The results reported here were based on equal district weighting. The population and minority weighting were also given in terms of census population and ethnic-population, respectively, but not reported. These weights are geographical evaluation weights and not sampling weights for the MICS or individual maternal-risk weights and minor weighting does not measures prediction accuracy specifically for minority women.
3.8. Stage G Robustness diagnostics and interpretation
The stability of the performance was evaluated via conditional stability with 2,000 bootstrap resample replicates of the eight division-level blocks of fixed held-out predictions. Conditional stability intervals were reported for the 2.5th and 97.5th percentile. The intervals are not necessarily survey-design confidence intervals, external-validation intervals, or full retraining uncertainty (Efron, 1979; Varoquaux, 2018). To compare the performance of Random Forest with that of each comparator, paired resamples were performed, where negative Random Forest-minus-comparator error values represent better Random Forest performance.
The ordinary least-squares coefficients are reported per 10-percentage-point change in each predictor for interpretability and a stability analysis of the coefficients was conducted using the same division-block resampling. The weighted increase in MAE after 30 permutations for every predictor was used as an estimate of the Random Forest permutation importance. Carriero et al. (2025) interpret "importance" as model dependence, rather than as a causal mechanism or causal explanation of ethnic inequality.
The outcomes and records that had flags on either the predictor or the outcome were removed from the analyses, and alternative depths and minimum leaf size for the Random Forest were tested, in addition to geographical validation, and comparison to random 8-fold splitting. Other checks included alternative ethnic-concentration specifications, introduction of phone ownership, influential districts, residual patterns and predictions outside the 0–100 range.
Analyses were conducted in Python 3.13.5 using NumPy 2.3.5, pandas 2.2.3, SciPy 1.17.0, and scikit-learn 1.8.0. Reporting was in line with the STROBE principles and applicable TRIPOD+AI transparency principles, but acknowledging that the prediction unit was the district rather than the individual patient (Collins et al., 2024; von Elm et al., 2007).
4. Results
4.1. Ethnic differences across the maternal-care pathway
Table 2 shows 9 indicators and associated contrasts. In both rounds, the maternal-service point estimates were each less for Other. The rate of institutional delivery increased from 17.3% to 43.3% in Other households and from 53.8% to 71.2% in Bengali households. The deficit gap was reduced from 36.5 percentage points to 27.9 and the ratio of Other/Bengali increased from 0.32 to 0.61, respectively. These are comparisons of survey populations, not intra-woman comparison.
Table 2.Indicators
| Indicators | Bengali 2019 | Other 2019 | Bengali 2025 | Other 2025 | 2025 gap | Gap change |
|---|---|---|---|---|---|---|
| Skilled antenatal care ≥1 | 75.7 | 26.5 | 89.9 | 64.9 | -25.0 | 24.2 |
| Antenatal contacts ≥4 | 37.2 | 9.1 | 43.4 | 20.8 | -22.6 | 5.5 |
| Institutional delivery | 53.8 | 17.3 | 71.2 | 43.3 | -27.9 | 8.6 |
| Skilled delivery attendance | 59.4 | 19.3 | 77.8 | 52.6 | -25.2 | 14.9 |
| Maternal postnatal check | 65.6 | 42.9 | 70.5 | 69.1 | -1.4 | 21.3 |
| Newborn postnatal check | 66.9 | 42.9 | 72.8 | 68.7 | -4.1 | 19.9 |
| Modern contraceptive use | 59.1 | 61.3 | 54.6 | 63.1 | 8.5 | 6.3 |
| Demand satisfied: modern | 77.4 | 79.3 | 73.4 | 80.1 | 6.7 | 4.8 |
| Unmet family-planning need | 13.7 | 13.9 | 16.2 | 13.5 | -2.7 | -2.9 |
The gap between skilled antenatal attendance and Other, Bengali households decreased by 38.4 and 14.2 points respectively to 25.0 points. The four or more contacts gap dropped from 28.1 to 22.6 points and 2025 coverage was 20.8% and 43.4%, respectively. Skilled delivery attendance was 52.6% and 77.8%, respectively, showing a 25.2 point gap from 40.1 points in 2019.
To compare the signed ethnic gaps, no arbitrariness was required in choosing the direction on all indicators; the result is shown in Figure 2.
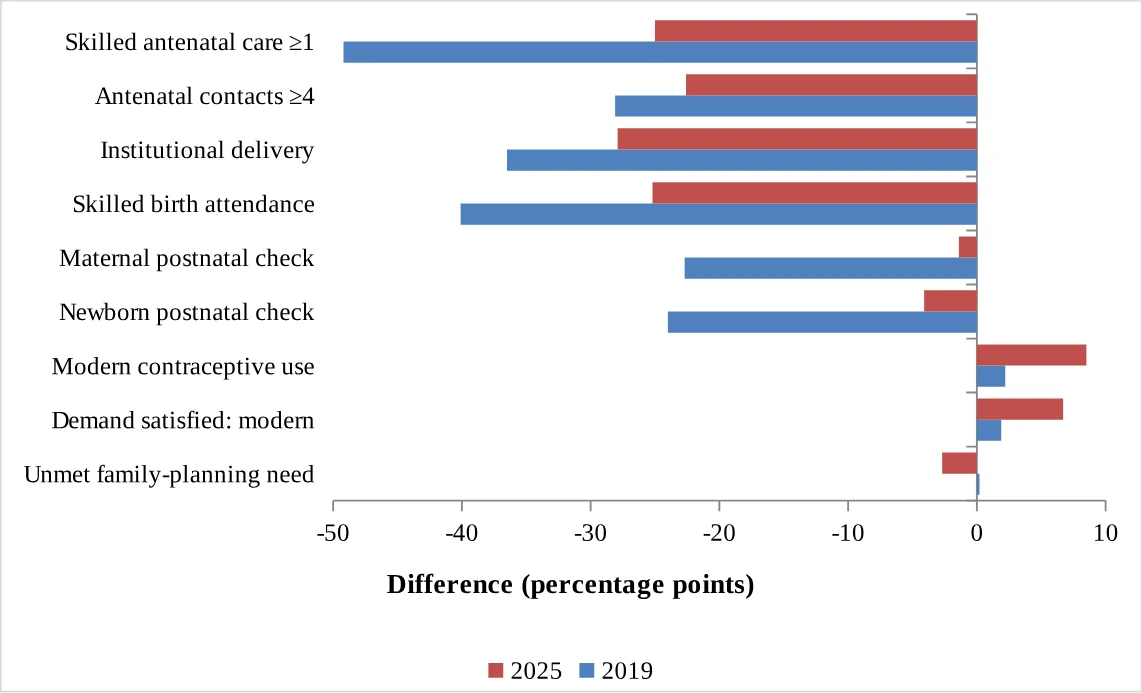
The difference between prenatal and delivery failures was still larger than the difference between postnatal-check failures. A lack of subgroup sampling uncertainty does not constitute a descriptive narrowing, as this information was not available.
The gap for maternal postnatal check was lowered from 22.7 to 1.4 points; and for newborn check, it was lowered from 24.0 to 4.1 points. These co-occurring check indicators cannot create equivalency of timing, content, and/or quality of care. Rounding gaps are less than the antenatal and delivery gaps, but do not address survey precision.
4.2. Family planning did not follow a uniform disadvantage pattern
In both rounds there was a higher rate of modern contraceptive use in the Other category. Its advantage increased from 2.2 to 8.5 points, reaching 63.1% versus 54.6% in 2025. In 2025, there was a 6.7-point gap in favour of demand met with modern methods. Unmet need increased by 2.7 points, from 0.2 point in 2019 to 2.7 points in 2025, with estimates of 13.5% and 16.2%.
This pattern shows that it is not appropriate to aggregate all the reproductive and maternal indicators to one deficit score. Indicated differences between family-planning and recent-birth indicators cannot refer to the same population of women. There was uncertainty about sampling for the smaller differences that was not tested.
4.3. Geographical heterogeneity in institutional delivery
The mean coverage of institutional delivery was 52.0% across 64 districts, the standard deviation 17.3 points and the median 52.8%. The interquartile range was 41.3%–65.6% and the coverage was from 15.4% in Bandarban to 93.1% in Meherpur. The district summary figures are not weighted and are not the same as the national figure of 53.4% based on the weighted district survey results.
The mean literacy rate of women aged 15 –24 was 88.8%, while 34.1% of households had Internet access, 69.0% of women owned mobile phones, and 24.7% of women were early mothers. There were no missing variables selected. There were 16 districts with outcome precision flags and 19 with a flag for any flagged variable. All were included in the main analysis and examined using exclusion sensitivities.
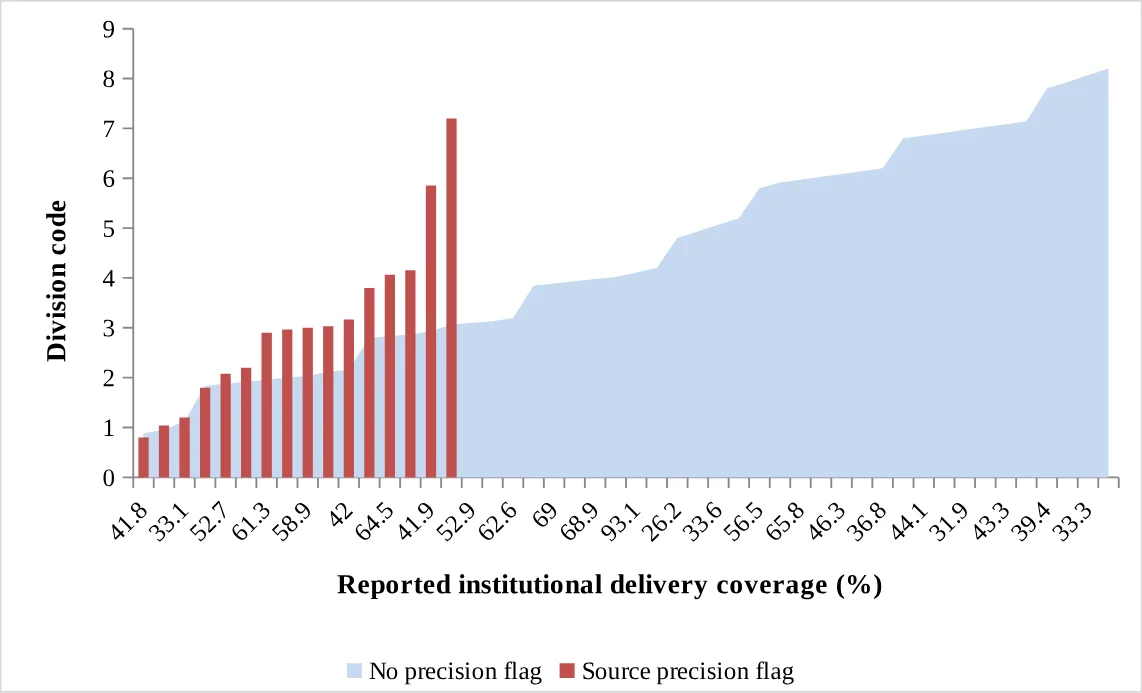
Variation within and between divisions is illustrated in figure 3, and outcomes that have been marked as sources are shown. These district estimates are based on the geographical aspects of the area without indicating the experience of specific groups of ethnicities within each district.
4.4. Geographical validation favoured simpler models
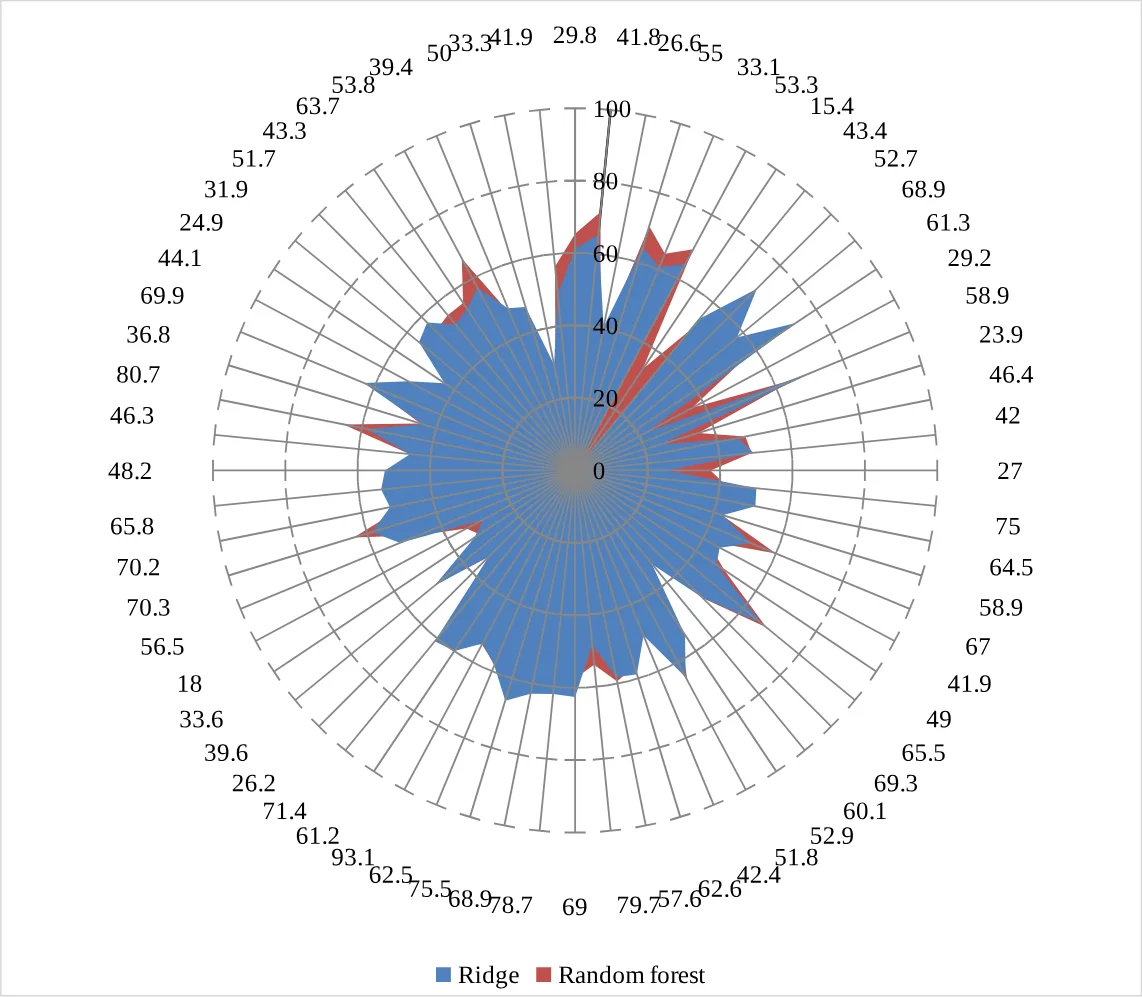
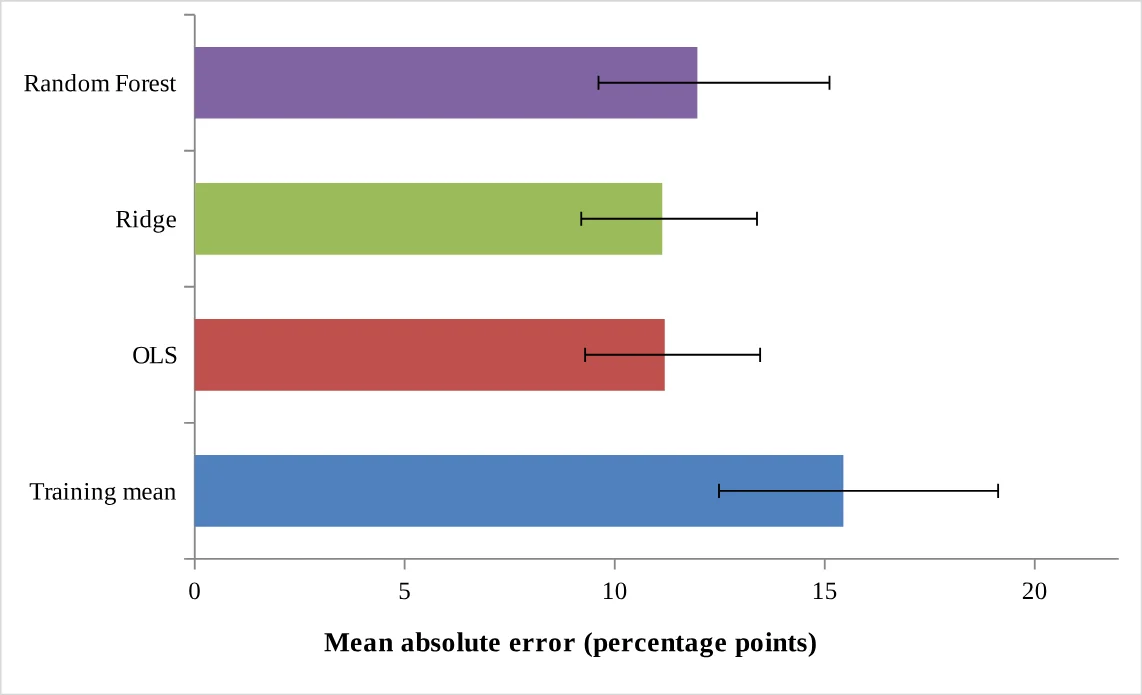
Held out performance is summarised in Table 3. The lowest MAE was obtained by ridge (11.13 percentage points), followed by ordinary least squares with MAE of 11.19, random forest with MAE of 11.97, and the training mean with MAE of 15.44. Root mean squared errors were 14.14, 14.23, 15.19, and 18.51 points, respectively; pooled held-out R-squared values were 0.322, 0.314, 0.217, and −0.162.
Table 3. Prediction performance under leave-one-division-out validation
| Model | MAE | Conditional 95% MAE interval | RMSE | Held-out R² |
|---|---|---|---|---|
| Training mean | 15.44 | 12.48–19.13 | 18.51 | -0.162 |
| OLS | 11.19 | 9.30–13.46 | 14.23 | 0.314 |
| Ridge | 11.13 | 9.20–13.39 | 14.14 | 0.322 |
| Random forest | 11.97 | 9.61–15.11 | 15.19 | 0.217 |
Note. Each district was predicted using a fixed-setting model trained without its division. The diagonal represents perfect agreement. Source: analysis of BBS and UNICEF (2021) district estimates.
There were large local gaps between both models and observations, with smaller differences to observations than the models predicted. This agreement is not about individual delivery options but rather district estimates.
The block-resampling 95% CIs for MAE were 9.20–13.39 for ridge, 9.30–13.46 for ordinary least squares, 9.61–15.11 for Random Forest and 12.48–19.13 for the training mean (Figure 5).
Note. Whiskers are conditional 95% intervals from 2,000 resamples of fixed division-level prediction-error blocks. They are not survey-design confidence intervals and do not propagate all refitting uncertainty.
The difference between the paired Random Forest-minus-ridge MAE was 0.84 points with a conditional interval of −0.04 to 1.92. The mean difference from the training was −3.48 points (interval −7.20 to 0.49). The intervals are not necessarily algorithmic superior and do not include survey uncertainty, but include some fitting uncertainty.
The MAE value of the Random Forest model ranged from 23.00 points in Barishal district to 7.78 points in Sylhet. The mean signed errors were +23.00 and −14.46 for Barishal and Khulna respectively. So, the sign of some of the errors was counteracted by the combined bias of −0.51 points.
4.5. Interpretation and sensitivity checks
The division-block coefficient interval for the all-district linear model was 18.90 (11.34–30.83) points of delivery coverage for a 10 point difference in literacy. Internet access, phone ownership and early childbearing had corresponding coefficients of 2.35, 1.75 and 1.91 points, respectively, over a range of zero. These are associations that occur between districts, but do not have any causal interpretation.
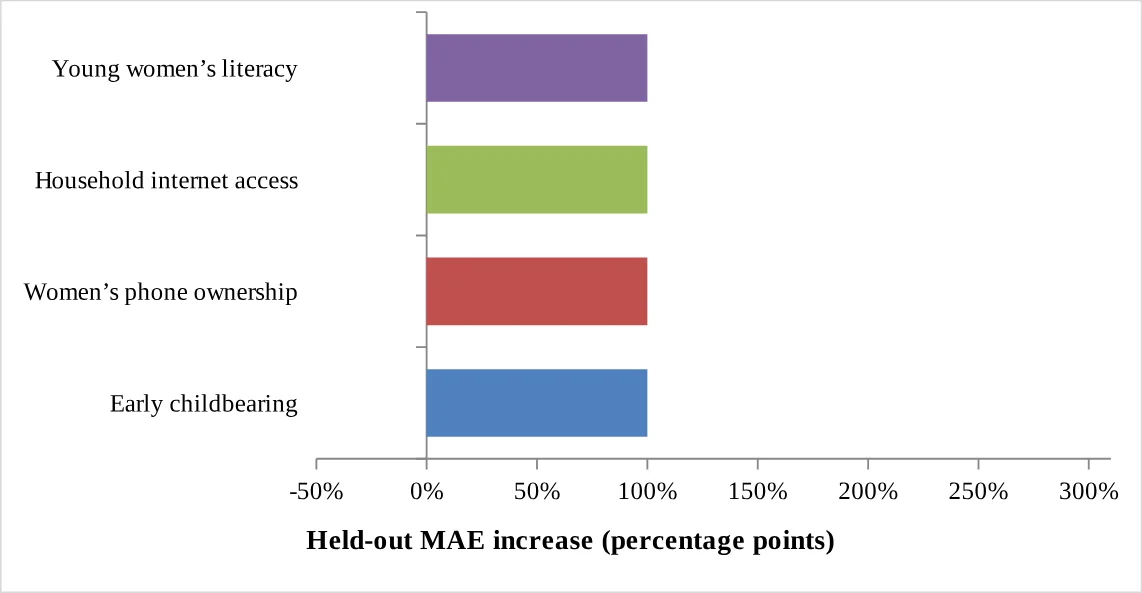
Permutation importance of held out random forest is shown in figure 6. The average MAE was greater for women who permuted literacy than for women who did not (2.59 points versus 0.35 points for internet access, −0.01 points for phone ownership and 0.02 points for early childbearing).
Note. Values are test-size-weighted mean increases in MAE from 30 within-division permutations per predictor. Negative importance is retained. These values describe model dependence, not causal effects.
Importance was different for each division and some of the values were negative. Within this model, literacy was the strongest contextual signal but its mechanism and why there are national ethnic gaps could not be established by the analysis.
For 16 outcome-flagged districts, the ridge and Random Forest MAEs were 12.38 and 12.87 points. Excluding all selected-variable flags left 45 districts and MAEs of 11.37 and 11.90. MAE values were between 11.90 and 12.40, greater than the principal ridge estimate, across four alternative forest specifications. Lower errors of 10.15 and 11.17 were obtained with random 8-fold splitting, and considered a different geographical transfer task.
The results reported do not include the extra components of Figure 1: divisional ANC4 inference, co-coverage bounds, census-linked association models, and nested and weighted validation. Without them, they can only be used to make the descriptive contrasts and the fixed-setting benchmarks above.
5. Discussion
5.1. Coverage progress and remaining inequalities
The antenatal and delivery coverage was found to have improved in the category Other with significant variations in 2025. Described using absolute measures: The gap between institutional delivery and the coverage ratio has risen to 0.61, but the gap between institutional delivery has remained at 27.9 points. Both measures fail to reflect the impact of compositional changes in populations as well as changes in treatment/service provision (Barros & Victora, 2013; Victora et al., 2003).
The findings indicator needs to be read indicator by indicator, as is the case in the Other category which has high levels of contraceptive use and satisfaction with the demand for contraceptives. The difference between services is in the number of people that the services serve, the type of delivery method, and the need for resources, but the information available does not specify which factors cause the difference. Ethnicity research on WASH has paved the way for disaggregated monitoring, but it does not provide ways of the maternal-health differences (Alam, 2022; Alam & Sheoti, 2024)
5.2. Different stages of care warrant different responses
Clinically similar material or quality does not necessarily occur when there are closer intervals between postnatal checks. The attendance timeline for antenatal care is distinct from the number of contacts attended and the disparities in the rate of postnatal visits by socioeconomic and regional divisions have been found in Bangladesh studies. These dimensions also do not appear to overlap in some manner with ethnicity as revealed by two category tables (Pervin et al., 2021; Supti et al., 2026).Three delays in access and three delays in the framework outlined by (Levesque et al., 2013) and (Thaddeus & Maine, 1994) suggest that distance, cost, communication, trust and referral are possible barriers to access. In a pluralistic system, the affordability and respectful care also need to be assessed when there is an increase in the number of facilities contacted. In this case, these mechanisms were not actually measured (Ahmed et al., 2013; Bohren et al., 2015).
5.3. What the district models contribute
Literacy was the most succinct contextual indicator, and was a general correlate of other indicators identified in studies in Bangladesh that associate education and community characteristics with facility use. However, district coefficients are not able to account for the adjusted individual association (Huda et al., 2019; Khan et al., 2022), and they also suffer from not being able to capture the population composition, services and unobserved context.Connectivity measures as incremental predictions have also weak ability to predict the effectiveness of digital-health interventions.
Near-zero or negative permutation importance can be due to relationships that are unstable or due to information overlap. Within-division permutation calculates the information due to the variability in the districts within a withheld division and is unable to recover all of the between-division information (Carriero et al., 2025; Shmueli, 2025). The point-estimate error for the tested forest was greater than ridge and ordinary least squares; this suggests that the forest is acceptable for comparing with other benchmarks, but other predictors or nested tuning are free to be assessed (Breiman, 2001; Christodoulou et al., 2019).
5.4. Geographical validation changes the interpretation of usefulness
The lower random-split errors illustrate the impact of the validation design on the change in prediction task. Withholding divisions assess (Meyer et al., 2018; Roberts et al., 2017).Beyond a region represented in training. This is not temporally validated and there may be some spatial influence which is common among administrative divisions. There were also errors as published results were considered as fixed targets and therefore unpredictable (Wakefield, 2008).
It's significant that it is argued against the division-specific bias in order to see why a small pooled bias cannot claim to be useful locally. Conditional block intervals are stability intervals over observed divisions, and don't necessarily include all future prediction uncertainty. In this small sample, however, a small difference in performance is not enough to warrant implementation (Riley et al., 2019; Steyerberg et al., 2010; Varoquaux, 2018).
5.5. Implications for equity-sensitive analytical practice
The district benchmark does not include an ethnic-composition predictor, thus errors do not allow for fair comparisons between Bengali and Other women. A performance summary at the area level would still be generated even if it was purely on the basis of census minorities. In the case of individual fairness assessment, the outcomes and predictions should be given for the groups of interest (Leslie et al., 2021; Rajkomar et al., 2018)The institutional delivery indicator measures service contact and not need or service quality. Before assuming their use, operational use of target selection and proxy variables should be considered (Obermeyer et al., 2019). This would require individual prediction to be calibrated in the future, and further to be evaluated in subgroups and validated externally. Reporting standards can be used to make the models transparent, but they do not provide evidence for model validity (Collins et al., 2024; On behalf of Topic Group ‘Evaluating diagnostic tests and prediction models’ of the STRATOS initiative et al., 2019; Shmueli, 2025)
5.6. Public-health and policy implications
As there is no ethnic-composition predictor in the district benchmark, it is not possible to make a fair comparison between Bengali and Other women. Even if it were only census population of minorities that was strictly used for weighting, a performance summary at the area level would be created. Outcomes and predictions are needed for groups of interest for individual fairness assessment (Leslie et al., 2021; Rajkomar et al., 2018).
The institutional delivery indicator does not measure need or service quality, but is rather a measure of service contact. The use of target selection and proxy variables should not be assumed, but should be looked at operationally (Obermeyer et al., 2019). If prediction was to be individualised then it would have to be calibrated and the subgroups assessed and validated in the future. Standards of reporting offer transparency but do not provide evidence of the validity of the model based on district MAE alone (Christodoulou et al., 2019; Collins et al., 2024; Shmueli, 2025)
5.7. Limitations and future research
Marginal tables published in the public documents do not allow for individual level ethnic comparisons or modelling at the household level, and changes across survey rounds may be due to service changes, population changes, or sampling variation. This is because there were no ethnicity-specific standard errors and no weighted denominators were treated as numbers of observations for formal inference. The ethnic classification at the household level is not able to identify individuals or specific minority groups.
The ecological analysis used only 64 districts and four predictors; factors like transport, facility readiness, parity and minority population share were not included. As such, the associations at the area level should not be viewed as individual effects. Only one survey round and eight administrative holdouts were used in the validation and several expanded analyses were not carried out.
Further studies should utilize authorized microdata that includes information on the design of the survey, more detailed categories of ethnicity (where rules of disclosure allow), the multiple surveys for temporal validation, and independent measures of service accessibility. Qualitative research with minority communities is also required to explore how the differences in coverage explained in the observations can be understood.
6. Conclusion
While several gaps in maternal care is expected to be narrowed between 2019 and 2025, there are still big gaps in antenatal and delivery care. The meaning of family planning indicators needs to be worked out individually. Random Forest was not superior to linear models in the 64-district benchmark when the validation was done by dividing the data. Results are supportive for service specific monitoring, geographical performance assessment, but do not confirm individual ethnic effects and causal mechanisms, and do not indicate operational readiness. Conclusions for joint coverage should be drawn first and then the other analyses.The other analyses (ethnic concentration analysis on census and nested weighted predication analysis) should be conducted after joint coverage analysis.
Data availability
The public source reports referenced are listed in the reference (BBS & UNICEF, 2019, 2021, 2026). Provenance, CSV results, Python verification code, reconstructed training-mean predictions, 64 chart-derived records with ridges and Random Forest predictions, and 36 national percentages are provided in Supporting Information S1. Reproduces national differences and prediction metrics available. None of the original district predictors or the district-keyed extraction ledger, model-fitting code or complete resampling and sensitivity outputs are currently available. The package offers partial verification and not complete reproduction. For this revision, no microdata at the respondent level were used.
Author declarations
Ethics approval and consent to participate: Secondary analysis of public aggregate statistics, without recruitment or identifiable records.
Conflict of Interest Statement
The authors declare that they have no conflicts of interest relevant to this work.
Transparency Declaration
The lead author, as manuscript guarantor, affirms that this manuscript is an honest, accurate, and transparent account of the study being reported; that no important aspects of the study have been omitted; and that any discrepancies from the study as planned have been explained.
Use of Artificial Intelligence Tools
OpenAI ChatGPT was used to assist with language editing, manuscript organisation, formatting, and preparation and checking of analytical code and figures. All data extraction decisions, statistical analyses, numerical results, references, interpretations, and final manuscript content were reviewed and verified by the authors. The authors take full responsibility for the accuracy and integrity of the submitted work. ChatGPT was not treated as an author and did not independently determine authorship, accountability, or research conclusions.
Ethics Approval and Consent to Participate
This study analysed publicly available aggregate statistical data and did not involve recruitment of participants, access to identifiable information, or analysis of respondent-level microdata. The original Bangladesh MICS 2025 survey received ethical approval from the icddr,b Ethical Review Committee in November 2024, reference PR-24113. That approval relates to the original survey and does not constitute ethics approval for the present secondary analysis.
References
- Ahmed, S. M., Evans, T. G., Standing, H., & Mahmud, S. (2013). Harnessing pluralism for better health in Bangladesh. The Lancet, 382(9906), 1746–1755. https://doi.org/10.1016/S0140-6736(13)62147-9
- Alam, M. Z. (2022). Ethnic inequalities in access to WASH in Bangladesh. The Lancet Global Health, 10(8), e1086–e1087. https://doi.org/10.1016/S2214-109X(22)00232-7
- Alam, M. Z., & Sheoti, I. H. (2024). Ethnicity and access to water, sanitation, and hygiene in Bangladesh: A study using MICS data and policy reviews. BMC Public Health, 24, Article 2726. https://doi.org/10.1186/s12889-024-20250-0 Bangladesh Bureau of Statistics. (n.d.). Population and housing census. Retrieved October 14, 2026, from https://bbs.gov.bd/site/page/47856ad0-7e1c-4aab-bd78-892733bc06eb/Population-and-Housing-Census%3A Bangladesh Bureau of Statistics, & UNICEF Bangladesh (2019). Progotir Pathey, Bangladesh Multiple Indicator Cluster Survey 2019: Survey findings report. https://www.unicef.org/bangladesh/media/3281/file/Bangladesh%202019%20MICS%20Report_English.pdf Bangladesh Bureau of Statistics, & UNICEF Bangladesh (2021). Progotir Pathey, Bangladesh Multiple Indicator Cluster Survey 2019: District summary findings. https://objectstorage.ap-dcc-gazipur-1.oraclecloud15.com/n/axvjbnqprylg/b/V2Ministry/o/office-bbs/2024/12/3d59154b372d4348be400bd0d50228ad.pdf Bangladesh Bureau of Statistics, & UNICEF Bangladesh (2026). Progotir Pathey, Bangladesh Multiple Indicator Cluster Survey 2025: Survey findings report. https://www.unicef.org/bangladesh/en/reports/bangladesh-multiple-indicator-cluster-survey-2025-0
- Barros, A. J. D., & Victora, C. G. (2013). Measuring coverage in MNCH: Determining and interpreting inequalities in coverage of maternal, newborn, and child health interventions. PLOS Medicine, 10(5), Article e1001390. https://doi.org/10.1371/journal.pmed.1001390
- Bohren, M. A., Hunter, E. C., Munthe-Kaas, H. M., Souza, J. P., Vogel, J. P., & Gülmezoglu, A. M. (2014). Facilitators and barriers to facility-based delivery in low- and middle-income countries: A qualitative evidence synthesis. Reproductive Health, 11, Article 71. https://doi.org/10.1186/1742-4755-11-71
- Bohren, M. A., Vogel, J. P., Hunter, E. C., Lutsiv, O., Makh, S. K., Souza, J. P., Aguiar, C., Saraiva Coneglian, F., Diniz, A. L. A., Tunçalp, Ö., Javadi, D., Oladapo, O. T., Khosla, R., Hindin, M. J., & Gülmezoglu, A. M. (2015). The mistreatment of women during childbirth in health facilities globally: A mixed-methods systematic review. PLOS Medicine, 12(6), Article e1001847. https://doi.org/10.1371/journal.pmed.1001847
- Braveman, P., & Gruskin, S. (2003). Defining equity in health. Journal of Epidemiology and Community Health, 57(4), 254–258. https://doi.org/10.1136/jech.57.4.254
- Braveman, P. A., Kumanyika, S., Fielding, J., LaVeist, T., Borrell, L. N., Manderscheid, R., & Troutman, A. (2011). Health disparities and health equity: The issue is justice. American Journal of Public Health, 101(Suppl. 1), S149–S155. https://doi.org/10.2105/AJPH.2010.300062
- Breiman, L. (2001). Random forests. Machine Learning, 45(1), 5–32. https://doi.org/10.1023/A:1010933404324
- Carriero, A., de Hond, A., Cappers, B., Paulovich, F., Abeln, S., Moons, K. G. M., & van Smeden, M. (2025). Explainable AI in healthcare: To explain, to predict, or to describe? Diagnostic and Prognostic Research, 9, Article 29. https://doi.org/10.1186/s41512-025-00213-8
- Chowdhury, A. M. R., Bhuiya, A., Chowdhury, M. E., Rasheed, S., Hussain, Z., & Chen, L. C. (2013). The Bangladesh paradox: Exceptional health achievement despite economic poverty. The Lancet, 382(9906), 1734–1745. https://doi.org/10.1016/S0140-6736(13)62148-0
- Christodoulou, E., Ma, J., Collins, G. S., Steyerberg, E. W., Verbakel, J. Y., & Van Calster, B. (2019). A systematic review shows no performance benefit of machine learning over logistic regression for clinical prediction models. Journal of Clinical Epidemiology, 110, 12–22. https://doi.org/10.1016/j.jclinepi.2019.02.004
- Collins, G. S., Moons, K. G. M., Dhiman, P., Riley, R. D., Beam, A. L., Van Calster, B., Ghassemi, M., Liu, X., Reitsma, J. B., van Smeden, M., Boulesteix, A.-L., Camaradou, J. C., Celi, L. A., Denaxas, S., Denniston, A. K., Glocker, B., Golub, R. M., Harvey, H., Heinze, G., … Logullo, P. (2024). TRIPOD+AI statement: Updated guidance for reporting clinical prediction models that use regression or machine learning methods. BMJ, 385, Article e078378. https://doi.org/10.1136/bmj-2023-078378
- Efron, B. (1979). Bootstrap methods: Another look at the jackknife. The Annals of Statistics, 7(1), 1–26. https://doi.org/10.1214/aos/1176344552
- Filmer, D., & Pritchett, L. H. (2001). Estimating wealth effects without expenditure data—or tears: An application to educational enrollments in states of India. Demography, 38(1), 115–132. https://doi.org/10.1353/dem.2001.0003
- Gabrysch, S., & Campbell, O. M. R. (2009). Still too far to walk: Literature review of the determinants of delivery service use. BMC Pregnancy and Childbirth, 9, Article 34. https://doi.org/10.1186/1471-2393-9-34
- Heinze, G., Wallisch, C., & Dunkler, D. (2018). Variable selection: A review and recommendations for the practicing statistician. Biometrical Journal, 60(3), 431–449. https://doi.org/10.1002/bimj.201700067
- Holm, S. (1979). A simple sequentially rejective multiple test procedure. Scandinavian Journal of Statistics, 6(2), 65–70. https://www.jstor.org/stable/4615733
- Huda, T. M., Chowdhury, M., El Arifeen, S., & Dibley, M. J. (2019). Individual and community level factors associated with health facility delivery: A cross sectional multilevel analysis in Bangladesh. PLOS ONE, 14(2), Article e0211113. https://doi.org/10.1371/journal.pone.0211113
- Kapoor, S., & Narayanan, A. (2023). Leakage and the reproducibility crisis in machine-learning-based science. Patterns, 4(9), Article 100804. https://doi.org/10.1016/j.patter.2023.100804
- Khan, J. R., Ara, T., Rahman, M. M., Hossain, M. B., & Muurlink, O. (2022). A multilevel assessment of the influence of education on women’s uptake of institutional delivery services during childbirth in Bangladesh. Midwifery, 113, Article 103425. https://doi.org/10.1016/j.midw.2022.103425
- Khan, S., & Hancioglu, A. (2019). Multiple Indicator Cluster Surveys: Delivering robust data on children and women across the globe. Studies in Family Planning, 50(3), 279–286. https://doi.org/10.1111/sifp.12103
- Leslie, D., Mazumder, A., Peppin, A., Wolters, M. K., & Hagerty, A. (2021). Does “AI” stand for augmenting inequality in the era of covid-19 healthcare? BMJ, 372, Article n304. https://doi.org/10.1136/bmj.n304 Levesque, J.-F., Harris, M. F., & Russell, G. (2013). Patient-centred access to health care: Conceptualising access at the interface of health systems and populations. International Journal for Equity in Health, 12, Article 18. https://doi.org/10.1186/1475-9276-12-18
- MacKinnon, J. G., & White, H. (1985). Some heteroskedasticity-consistent covariance matrix estimators with improved finite sample properties. Journal of Econometrics, 29(3), 305–325. https://doi.org/10.1016/0304-4076(85)90158-7
- Marmot, M. (2005). Social determinants of health inequalities. The Lancet, 365(9464), 1099–1104. https://doi.org/10.1016/S0140-6736(05)71146-6
- Meyer, H., Reudenbach, C., Hengl, T., Katurji, M., & Nauss, T. (2018). Improving performance of spatio-temporal machine learning models using forward feature selection and target-oriented validation. Environmental Modelling & Software, 101, 1–9. https://doi.org/10.1016/j.envsoft.2017.12.001
- Obermeyer, Z., Powers, B., Vogeli, C., & Mullainathan, S. (2019). Dissecting racial bias in an algorithm used to manage the health of populations. Science, 366(6464), 447–453. https://doi.org/10.1126/science.aax2342
- Papke, L. E., & Wooldridge, J. M. (1996). Econometric methods for fractional response variables with an application to 401(k) plan participation rates. Journal of Applied Econometrics, 11(6), 619–632. https://doi.org/10.1002/(SICI)1099-1255(199611)11:6%3C619::AID-JAE418%3E3.0.CO;2-1
- Pervin, J., Venkateswaran, M., Nu, U. T., Rahman, M., O’Donnell, B. F., Friberg, I. K., Rahman, A., & Frøen, J. F. (2021). Determinants of utilization of antenatal and delivery care at the community level in rural Bangladesh. PLOS ONE, 16(9), Article e0257782. https://doi.org/10.1371/journal.pone.0257782
- Rajkomar, A., Hardt, M., Howell, M. D., Corrado, G., & Chin, M. H. (2018). Ensuring fairness in machine learning to advance health equity. Annals of Internal Medicine, 169(12), 866–872. https://doi.org/10.7326/M18-1990
- Riley, R. D., Snell, K. I. E., Ensor, J., Burke, D. L., Harrell, F. E., Jr., Moons, K. G. M., & Collins, G. S. (2019). Minimum sample size for developing a multivariable prediction model: Part I—Continuous outcomes. Statistics in Medicine, 38(7), 1262–1275. https://doi.org/10.1002/sim.7993
- Roberts, D. R., Bahn, V., Ciuti, S., Boyce, M. S., Elith, J., Guillera-Arroita, G., Hauenstein, S., Lahoz-Monfort, J. J., Schröder, B., Thuiller, W., Warton, D. I., Wintle, B. A., Hartig, F., & Dormann, C. F. (2017). Cross-validation strategies for data with temporal, spatial, hierarchical, or phylogenetic structure. Ecography, 40(8), 913–929. https://doi.org/10.1111/ecog.02881
- Shmueli, G. (2010). To explain or to predict? Statistical Science, 25(3), 289–310. https://doi.org/10.1214/10-STS330
- Shmueli, G. (2025). To explain, to predict, or to describe: Figuring out the study goal [Commentary on “On the uses and abuses of regression models” by Carlin and Moreno-Betancur]. Statistics in Medicine, 44(13–14), Article e10307. https://doi.org/10.1002/sim.10307
- Steyerberg, E. W., Vickers, A. J., Cook, N. R., Gerds, T., Gonen, M., Obuchowski, N., Pencina, M. J., & Kattan, M. W. (2010). Assessing the performance of prediction models: A framework for traditional and novel measures. Epidemiology, 21(1), 128–138. https://doi.org/10.1097/EDE.0b013e3181c30fb2
- Supti, S. S., Sultana, S., Akib, M. M. H., Saha, P., Yesmin, M., & Pal, B. (2026). Socioeconomic and regional disparities in postnatal care utilization in Bangladesh: Evidence from the Bangladesh Demographic and Health Survey 2022. PLOS Global Public Health, 6(2), Article e0005353. https://doi.org/10.1371/journal.pgph.0005353
- Thaddeus, S., & Maine, D. (1994). Too far to walk: Maternal mortality in context. Social Science & Medicine, 38(8), 1091–1110. https://doi.org/10.1016/0277-9536(94)90226-7
- Van Calster, B., McLernon, D. J., van Smeden, M., Wynants, L., Steyerberg, E. W., & Topic Group “Evaluating diagnostic tests and prediction models” of the STRATOS initiative (2019). Calibration: The Achilles heel of predictive analytics. BMC Medicine, 17, Article 230. https://doi.org/10.1186/s12916-019-1466-7
- Varoquaux, G. (2018). Cross-validation failure: Small sample sizes lead to large error bars. NeuroImage, 180(Part A), 68–77. https://doi.org/10.1016/j.neuroimage.2017.06.061
- Victora, C. G., Wagstaff, A., Schellenberg, J. A., Gwatkin, D., Claeson, M., & Habicht, J.-P. (2003). Applying an equity lens to child health and mortality: More of the same is not enough. The Lancet, 362(9379), 233–241. https://doi.org/10.1016/S0140-6736(03)13917-7 von Elm, E., Altman, D. G., Egger, M., Pocock, S. J., Gøtzsche, P. C., & Vandenbroucke, J. P. (2007). The Strengthening the Reporting of Observational Studies in Epidemiology (STROBE) statement: Guidelines for reporting observational studies. PLOS Medicine, 4(10), Article e296. https://doi.org/10.1371/journal.pmed.0040296
- Wakefield, J. (2008). Ecologic studies revisited. Annual Review of Public Health, 29, 75–90. https://doi.org/10.1146/annurev.publhealth.29.020907.090821
CITE THIS ARTICLE
Masrur, M. A. A. (2026). Ethnic and Geographical Inequalities in Maternal Healthcare Coverage in Bangladesh in a Repeated Cross-Sectional and Ecological Study. https://www.researchbymahir.com/article/8fab00ef-0c1e-4dd4-8586-ec6152ac6c5e
M. A. A. Masrur, “Ethnic and Geographical Inequalities in Maternal Healthcare Coverage in Bangladesh in a Repeated Cross-Sectional and Ecological Study,” 2026. [Online]. Available: https://www.researchbymahir.com/article/8fab00ef-0c1e-4dd4-8586-ec6152ac6c5e
Masrur, M. A. A. (2026) ‘Ethnic and Geographical Inequalities in Maternal Healthcare Coverage in Bangladesh in a Repeated Cross-Sectional and Ecological Study’. Available at: https://www.researchbymahir.com/article/8fab00ef-0c1e-4dd4-8586-ec6152ac6c5e
Masrur, Mahir Al Asif. “Ethnic and Geographical Inequalities in Maternal Healthcare Coverage in Bangladesh in a Repeated Cross-Sectional and Ecological Study.” 2026, https://www.researchbymahir.com/article/8fab00ef-0c1e-4dd4-8586-ec6152ac6c5e.
Mahir Al Asif Masrur. “Ethnic and Geographical Inequalities in Maternal Healthcare Coverage in Bangladesh in a Repeated Cross-Sectional and Ecological Study.” (2026). https://www.researchbymahir.com/article/8fab00ef-0c1e-4dd4-8586-ec6152ac6c5e.
Masrur MAA. Ethnic and Geographical Inequalities in Maternal Healthcare Coverage in Bangladesh in a Repeated Cross-Sectional and Ecological Study. 2026. https://www.researchbymahir.com/article/8fab00ef-0c1e-4dd4-8586-ec6152ac6c5e
@misc{article_8fab00ef0c1e4dd48586ec6152ac6c5e,
  title = {Ethnic and Geographical Inequalities in Maternal Healthcare Coverage in Bangladesh in a Repeated Cross-Sectional and Ecological Study},
  author = {Mahir Al Asif Masrur},
  year = {2026},
  url = {https://www.researchbymahir.com/article/8fab00ef-0c1e-4dd4-8586-ec6152ac6c5e},
}
TY - GEN AU - Mahir Al Asif Masrur TI - Ethnic and Geographical Inequalities in Maternal Healthcare Coverage in Bangladesh in a Repeated Cross-Sectional and Ecological Study PY - 2026 UR - https://www.researchbymahir.com/article/8fab00ef-0c1e-4dd4-8586-ec6152ac6c5e ER -